
It's time to take sales enablement back to basics and dive into our first lesson: Enablement metrics 101.
On the curriculum is why metrics are important in enablement, which metrics to use, and how to use data to inform your enablement strategy – and I'll share some examples and best practices from my career to date to help us along.
Why metrics?
First things first – why do we even need to bother with all of these numbers and data?
Roadmap building blocks
Honestly, metrics are the roadmap building blocks for enablement. It's cliché, but if you ask 10 sales leaders what their definition of enablement is, you'll get 10 completely different answers.
Since everyone's definition differs, it makes a lot of sense to align on key metrics to help define the goals of the department.
Using mutually-agreed-upon metrics with your executive sponsors in your enablement charter, business plan, or your roadmap (whatever you want to call it), will really help define what your enablement function is going to be responsible for.
Three things come to mind when I think about metrics:
1. They prove the efficacy of enablement
With there being so many different definitions of enablement out there, combined with it being a relatively new function for some companies, you want to be able to go back and say:
Yes, executive team, enablement is making a huge impact on the revenue team, and here's how.
Executives like to speak with data, and they like to make their decisions with data. If we come to the table with that data, it really helps prove our efficacy.
2. They help us stay focused
If you talk to any enablement leader, you'll know there are emails and Slack messages galore. We’re inundated with requests to do quite literally anything and everything:
- Can you make a training for this?
- I need a new onboarding program for this.
- I need a new playbook for this.
- Oh, we have new products coming out – can we do product training for this and a certification?
- We need a new pitch deck and some new messaging.
I literally could go on forever...
Staying focused as an enablement team is really difficult when you have all these requests coming at you. I've fallen victim to this too, looking back at the end of the year and thinking:
What did I even do this year? I just responded to a bunch of non-urgent, urgent requests. Did I move the needle for the entire revenue org?
Having metrics to fall back on helps you stay focused. If someone asks you to do this whole big program and it won't ultimately influence one of the metrics you're trying to influence? Don't do it.
Instead, say:
Hey, this is what the leadership team wants. This is what we're going to focus on. This is a bit out of scope for enablement right now.
It's really hard to say no, but you can use metrics to play the "bad cop" role.
3. Metrics can help inform your programming roadmap.
Keep this point in mind – I'll dive into this later and show you how I look at a set of metrics and build programming backwards from that.

Which metrics?
When I'm writing out my charter or business plan and it comes to thinking about which metrics I want to focus on and try to influence as an enablement team – I need to start at the very top.
Company’s revenue goal
I need to start with what the company is hoping to achieve. Every company is going to have a revenue target so that's a really good place to start.
Let's say, for example, your company target is $100 million, and last year you did $75 million. You want some pretty significant growth.
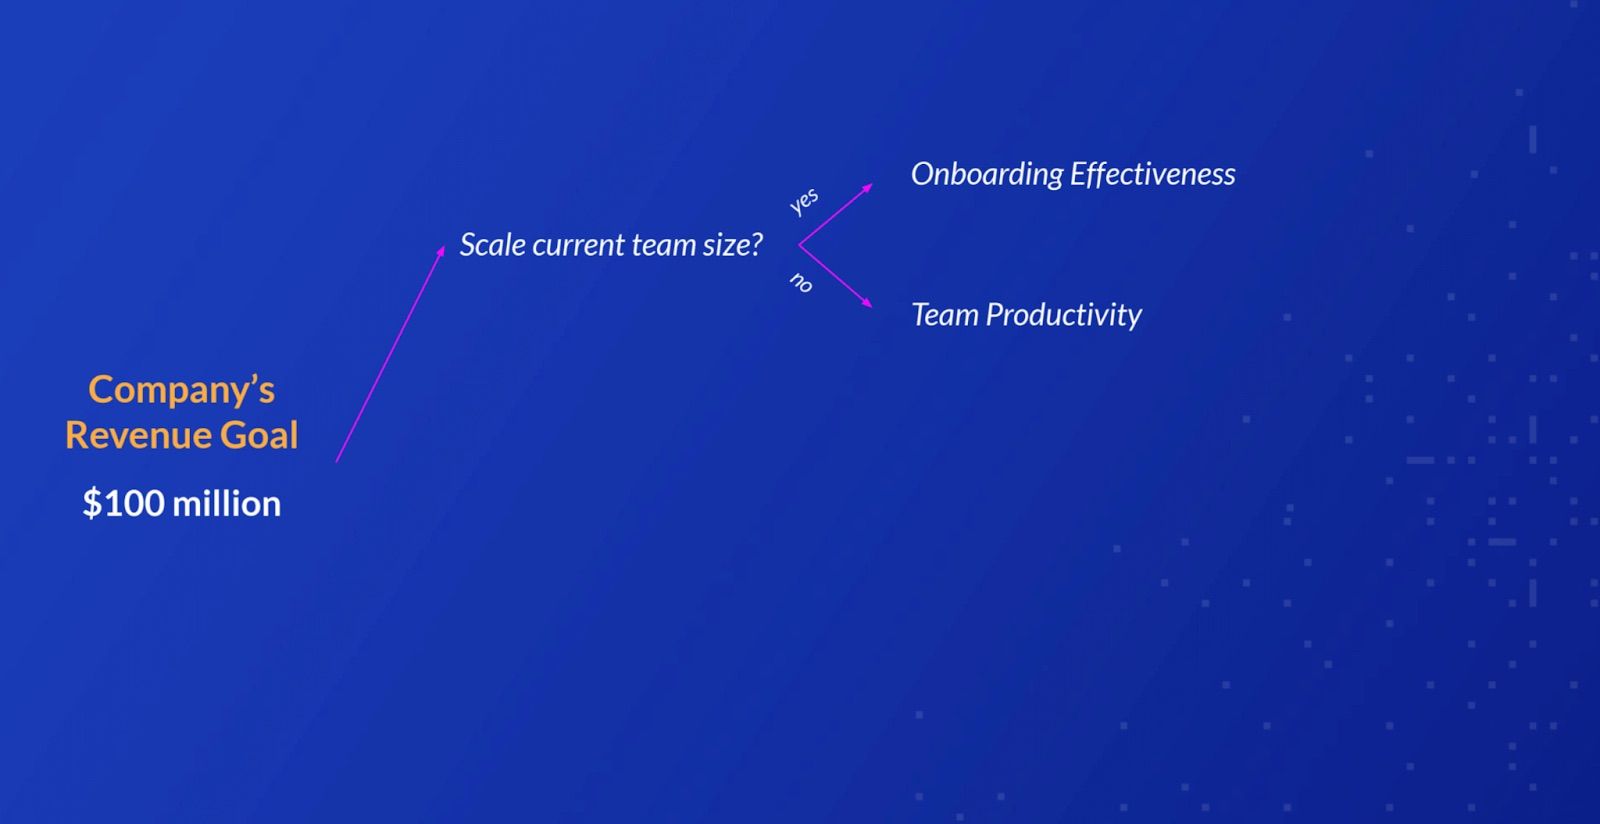
When you're thinking about how enablement can support achieving that revenue goal, my mind initially goes to two different questions I want to ask my executive sponsor - the Chief Revenue Officer.
Scale current team size?
The first one is whether we're going to achieve this by scaling our current team size:
- Are we going to grow our sales team and bring on a bunch of new sellers?
- Are we going to scale customer success account management?
- How are we going to do that?
- Is it a yes or no?
Yes = Onboarding effectiveness
If we are going to bring on a bunch of new hires, we want to make sure onboarding is super effective.
There are some metrics in there that we're going to want to align enablement to, so that if we succeed there, then we will ultimately succeed in helping bring more revenue into the organization.
No = Team productivity
Now if we're not going to scale the team, but still have this very big ambitious revenue target, team productivity is going to be the most important thing to focus on that year.
You need to get more revenue out of your existing team – if it was that easy, why didn't we just do it the year before?
Team productivity is an area that's super important, and I'll share some sample metrics further down.
And with that, I've learned about my current team size and whether or not we’re going to scale it – a great start.
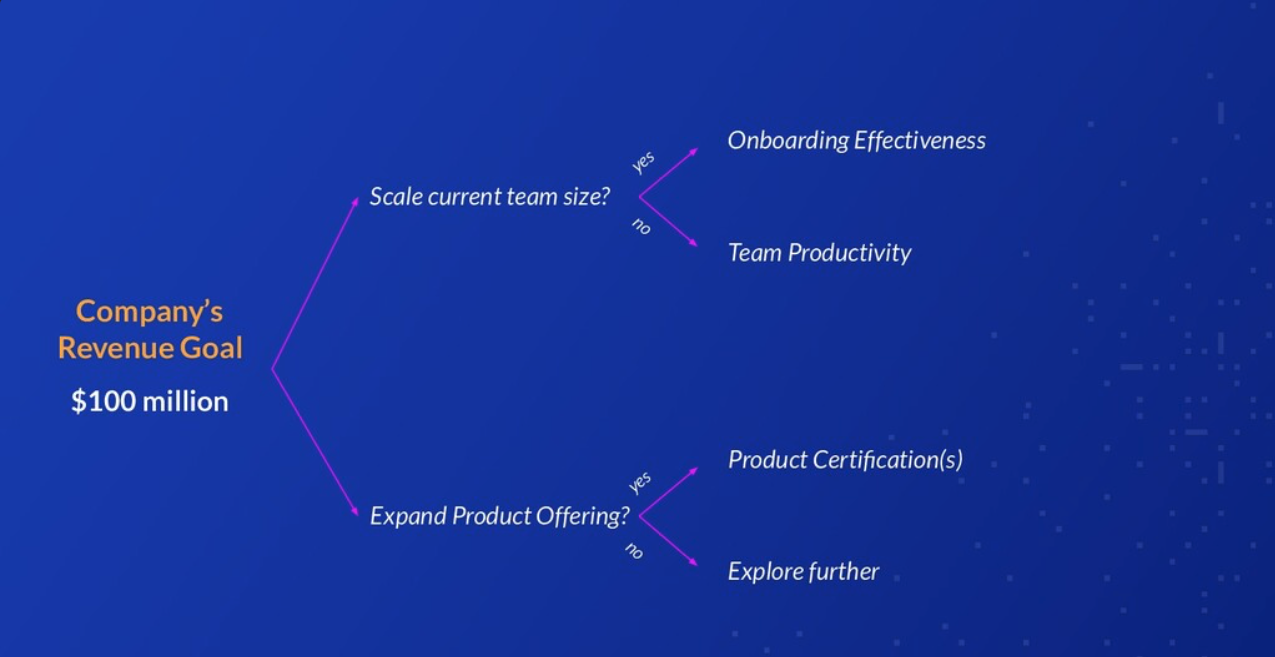
Expand product offering?
The second question I would ask my CRO is if we're planning on expanding our product or services.
- Are we hoping to get this increased revenue from our existing catalog or portfolio of products?
- Or are we going to introduce some new stuff to the market for sellers to sell?
Yes = Product certification(s)
If we are, product certifications become necessary - new products coming in, we've got to get everyone up to speed and confident to be able to pitch them and go into the market.
No = Explore further
If we're not, we want to explore a little bit further what exactly the approach could be from a metrics perspective to help inform our programming down the road.
Onboarding effectiveness
With those answers to hand, let's look at some sample metrics for each focus area.
These are just a few relating to onboarding effectiveness – there are plenty more out there – but these are the ones I typically gravitate towards and have been in my charter in the past.
Time to sales qualified lead
From the day someone starts in their role, to the time they have their first SQL – what's that timeframe look like?
But you can dig deeper:
- How does that compare to the trailing 12-month average?
- The previous year's new hire cohort, what was their average?
- How can you compare that?
Time to first sale
This is worth taking with a bit of a grain of salt. There could be a number of different factors involved in a new hire landing their first sale.
Someone could have warmed the client before the new hire got here and just handed it over to them. Or it could have been an inbound sale that was ready to buy and anyone could've been the seller.
No disrespect to new hires... but sometimes they get lucky!
That's great for confidence building, but it's also not that helpful in determining how effective your onboarding program is.
To account for that, I like to look at time to first sale and time to second sale, in particular what the difference between those two figures is.
I've also seen companies look at a time to first generated opportunity and sale, looking at having them start completely from scratch, cold turkey, brand new logo, and bring one in and evaluate it that way.
Time to first sale on its own is a bit of a sticky one.
Time to quota
This is a pretty obvious one. How long does it take for them to get to their year-to-date quota expectations?
I hope everyone reading this is giving their new hires a ramp quota. If you're not, I suggest you talk to your RevOps team to make that shift.
Even if their quotas are small quotas, achieving quota – especially early on in a sales career – helps build confidence. We want to make sure a confident sales team is a productive sales team.
Having that time to quota to hand and really examining it is important when you look at your overall onboarding program to analyze its effectiveness.
If we're trying to get to that $100 million in revenue and scale the team we need to bring people in quickly and get them ramped quickly. Onboarding is the pillar to do that through.

Team productivity
Moving on, these are some sample metrics to track when aiming to improve your existing team's productivity.
Quota attainment
We all look at this – but if 75% of your sales team is not at 75% of their year-to-date quota or better, then it's time to look into it a bit more closely.
Ask yourself where you could potentially influence the sales process to get everyone closer to quota (We'll walk you through an example shortly).
Contribution consistency
This is a personal favorite and something we started doing in a previous role was measuring this metric. You can track this in a couple of different ways.
In that previous role, we expected our sellers to bring in three new deals every month. In a given quarter, we would track how many months our sellers won a deal, and how close they got to bringing in all three – so either 100%, 66%, 33%, or zero.
Contribution consistency and quota attainment are not the same, and both are helpful, especially when looking at them in tandem.
If I have someone who's meeting quota but is highly inconsistent in their contribution, I can probably wager they have high-value deals coming in.
That’s great – but they maybe have some pipeline management issues we could try and diagnose, coach them on, and get them to that contribution consistency we expect of our sellers.
Quota attainment is a good story, contribution consistency is an even better one.
Time spent selling
Probably the hardest metric to measure in this article, I personally haven't quite cracked this yet.
Think about the amount of time sellers spend in:
- Internal meetings
- Talking to the product team about the roadmap and giving field input
- Pipeline meetings
All these meetings take them away from selling – and we need our salespeople selling, right?
In enablement, one of the things I always try and do is protect the reps’ calendars. I'm very strict about putting more than one hour a week on the reps’ calendars that has to do with training or anything besides selling.
Keep that to a minimum.
Once you've done that as an enablement team, you can then start working with other teams to streamline the number of meetings you have.
If we can improve time spent selling by even just 5%, imagine the type of returns we could get from that.
But this is a really hard one. I don't know how to measure time spent selling unless I actually pull calendar data and get IT to help me work out how many hours a week our reps are in non-client-facing meetings and go from there.
But there are a lot of consulting agencies that actually help with this – that could be a good starting point if this is a big area of concern for you.

Product knowledge
If you have a wide portfolio of products and services, chances are you also have revenue targets for each of those parts of the portfolio, which ultimately feed up to your overall revenue goal – which is worth keeping in mind.
The following are two sample metrics I use to track the level of product knowledge amongst sellers.
Portfolio concentration
One of the things you can track is the portfolio concentration of what your reps are selling and see if that aligns with the expected distribution from a revenue targeting perspective.
If we expect product A is going to be our breadwinner for the organization but product B is what sellers are selling the most, that means there's a discrepancy there and we need to figure out why that is.
Certification completion
I also like to go back to basics and look at certification completion ratios. Start by retraining everyone on product A and really focusing on product A for a while – make that the focus of the team from a training, enablement, and coaching perspective.
If your team is confident in their ability to pitch and sell products that is ultimately going to bring the revenue into the organization.
This is one of the areas to help you get there, confidence-wise.
Using metrics
Earlier, I mentioned using metrics to inform your enablement programming. Let me walk you through a clear-cut example of how I did this in a previous role.
Real-world example
I had this hypothesis that maybe our discovery process wasn't as efficient as it could be. It was taking four meetings to get an opportunity generated, and we were actually hoping it'd be closer to two.
This led me to believe our meetings just weren't effective enough. I worked with our RevOps team and asked them:
Hey – for all the new logos that we did in Year X – can you pull all of that data for me? Let's dissect it and see where some areas of opportunity are.
We started off by looking at the period from the first time a BDR or SDR contacted a prospect to actually getting the meeting. How many days was that? And how many touches did it take?
We found those numbers. Then we asked ourselves:
If we improve that by 5%, how much revenue will that impact downstream?
If you look at the fine print on the image below, we basically said:
- 5% better conversion would result in X many more meetings,
- Which translated to X many more wins, and we knew it took how many meetings per win to basically calculate that,
- Multiplied by the average in year revenue, or average deal size, however you measure that to ultimately determine...
- 5% improvement would mean $X million in additional revenue.
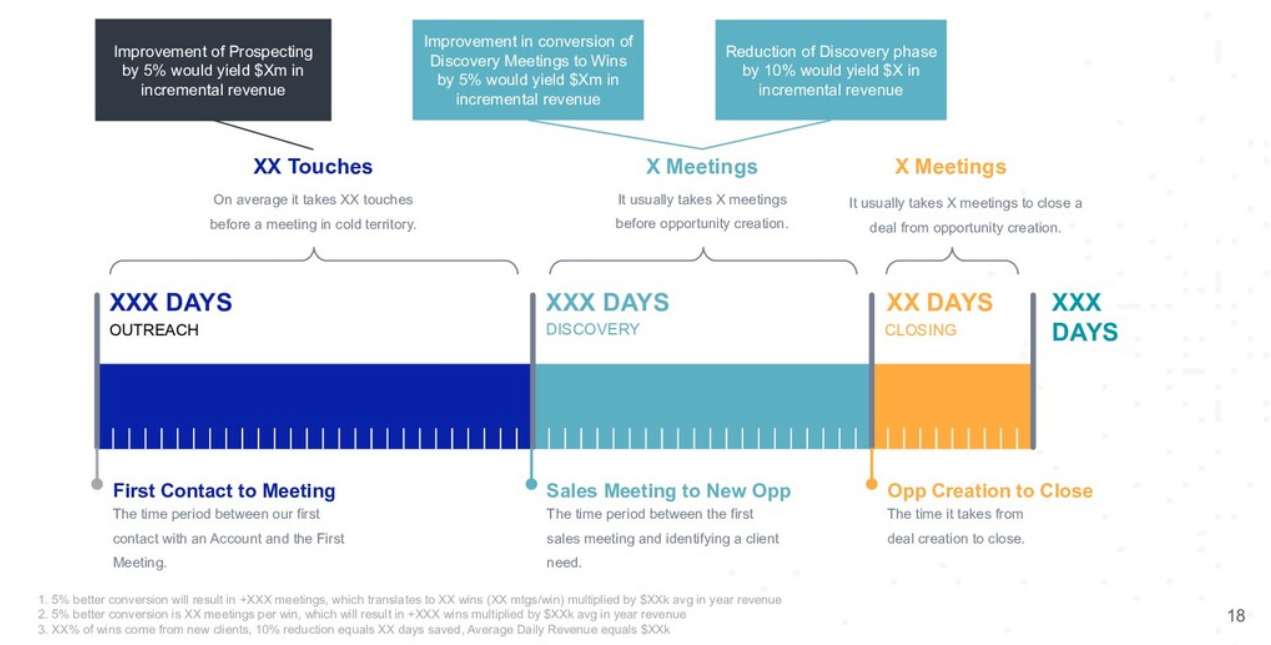
We applied that same approach with outreach and closing:
- From a sales meeting to a new opportunity – how many days? How many meetings?
- And once the opportunity was created, how long did it take to close?
If you look at the data and metrics that way and calculate the revenue impact you could have if we improve these things, that's great.
Executives love to see that sort of work. The CRO is not going to turn down an additional $X million in revenue, especially with a relatively small percentage of improvement.
Going forward, one of the things I thinking when planning is if we want to focus on discovery, I'm going to spend the entire quarter focusing on discovery. That's what we're going to focus on to find that 5% improvement of our discovery efficiency and measure from there.
Program metrics
When it comes to program metrics, don't forget about them! I chatted with Sheevaun Thatcher (Ex-enablement at RingCentral, Salesforce, now Demandbase) a few years ago, and one of the things she said that stuck out to me was:
If we can't measure the impact of a program, then we just don't do it.
It's similar to what I said at the beginning – metrics can be your bad cop if you're getting inundated with requests that lack focus. Let metrics be that focal point for you.
Discovery call example
Let's take a discovery call program as an example:
Baseline
- I'm going to have my baseline metric, let's say X number of days or X number of meetings to get from a meeting to an opportunity. That's my baseline.
Monitor
- Then I'm going to spend a quarter with all of my different programming, coaching, and different training materials – that sort of thing. I'm going to monitor the impact of that throughout the quarter.
Results
- Then I'm going to have my results at the end of the quarter and hopefully, you're going to see the baseline has been improved and you can attribute that to revenue.
Program metrics are super important. Remember them, monitor them, publicize them.
Using that as your guiding light I think is a really great way to prove the efficacy of enablement.
Reporting
I work very closely with RevOps to build reports and I'm aiming to build a dashboard for all the metrics I have in my charter, so I can consistently see how I'm progressing, especially when I have programs in place.
Scorecards
In a previous role, one of the things we had was a scorecard. It was much larger than the one below (and honestly a little overwhelming), but we had all of the metrics we cared about on the left.
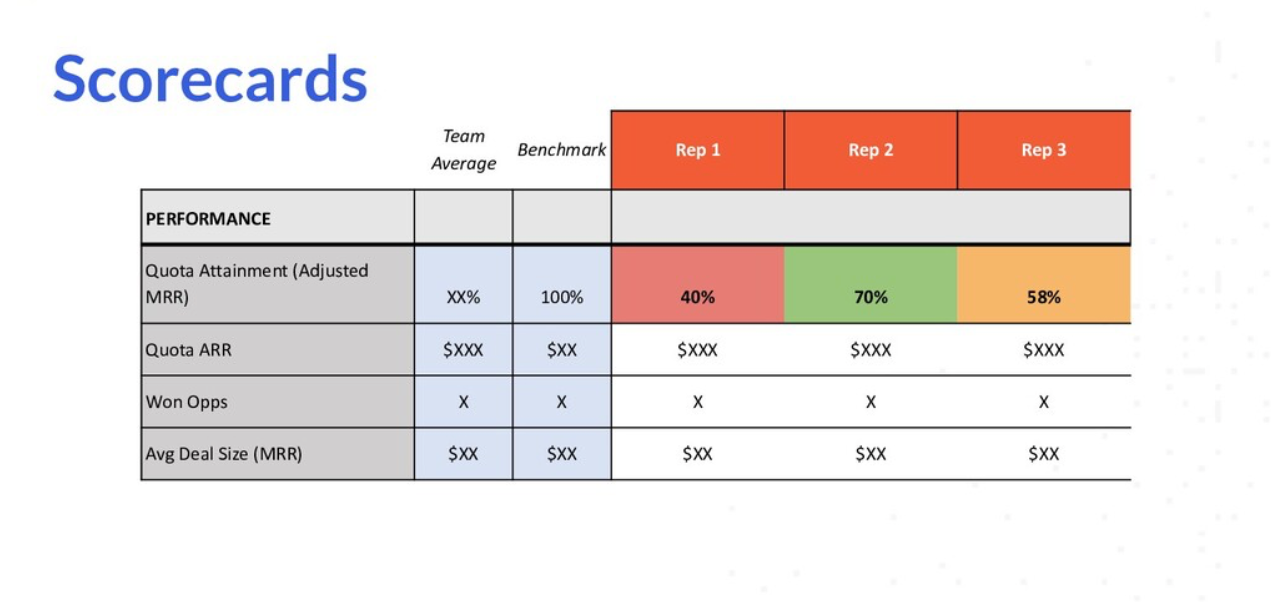
We had a team average and a benchmark, with each rep as a column in the spreadsheet. It allowed us to could look at trends, see how they were performing quarter over quarter, and it helped us dig into:
Okay, is there something happening on a rep level, or is it actually on a team-wide level?
We had these scorecards come out every quarter, produced by the Sales Ops team. I found them incredibly helpful, especially paired with a talent review to have the qualitative and the quantitative when looking at individual rep performance.
Wrapping up
I hope you enjoyed going back to basics with this enablement metrics 101 lesson – hopefully you've been able to learn from my experiences and can apply these metrics to help prove your team's effectiveness.
Good luck!
This article is based on Carly's presentation at our Revenue Acceleration Festival


Sales enablement insider
Thank you for subscribing
Level up your sales enablement career & network with sales enablement experts
An email has been successfully sent to confirm your subscription.
 Follow us on LinkedIn
Sales enablement insider
Thank you for subscribing
Level up your sales enablement career & network with sales enablement experts
An email has been successfully sent to confirm your subscription.


.svg)