
If there’s one topic that permeates (or plagues) enablement communities the most, it’s the topic of demonstrating enablement ROI. If your time in enablement has been anything like mine, then you too have spent a lot of time thinking about ROI. We know our value, but does the business? How do we defensibly demonstrate it?
While most enablement leaders know that proving impact is critical — for many, it’s easier said than done. In fact, 30.3% of enablement practitioners say their metrics only minimally reflect the value of their enablement efforts.
That’s a problem, not just for your enablement team, but for the business. Because organizations that perceive enablement as an ROI engine — and invest in the function as such — see 15% lift in win rates and 12% higher quota attainment.
Enablement teams are sitting on a goldmine of potential. Yet only 25% of sellers are hitting quota because the connection to business value isn’t crystal clear. It’s time to change that.
Get the full blueprint for showcasing the real value of enablement 👇
Proving impact at the initiative and functional levels
So how do you go beyond intuition and anecdotal success stories to build a clear, defensible case for enablement’s role in driving revenue outcomes? Course completions or content views alone won’t cut it. To truly demonstrate impact, you need a clear framework to connect your programs to business outcomes and show measurable success at both the program and functional level.
Both of these levels are imperative to focus on:
- The initiative level: the core results across unique change management efforts level.
- The functional level: the cumulative impact of enablement on the business.
At both of these levels, your mission is to drive sustainable behavior changes in revenue teams. Behavior changes that drive performance, and over time will impact business outcomes like improved, quota attainment, win rates, average deal size and better customer retention rates.
Let’s start by grounding ourselves in a few key principles.
The ground rules of sales enablement metrics and impact
First, while there are a few metrics that enablement can fully own, most are ones we influence. That’s why success depends on strong alignment with stakeholders across the revenue organization.
Second, our impact is rarely the sole cause of a business result. If a KPI improves, enablement might be one of several contributing factors. So let’s stop chasing causation and instead focus on tight correlation. A credible, data-driven connection between our efforts and performance gains is the goal.
Understanding leading vs. lagging sales enablement metrics and impact
A big part of building that connection is knowing which types of sales enablement metrics to track — specifically, leading vs. lagging indicators.
Leading indicators are the early signs that show if an enablement initiative is gaining traction. Are sellers completing training? Are they engaging with new content? Are they applying what they’ve learned?
Lagging indicators reflect the business outcomes enablement aims to influence — like win rates, revenue growth, or customer retention. These are the metrics that matter most to the business, and they’re the ones your enablement efforts should ultimately impact.
The 3-level framework for measuring sales enablement impact
To bring structure to how you measure impact, use this three-level framework for tracking sales enablement metrics:
Level 1: User adoption and reaction metrics
Start by measuring engagement. Track attendance, survey feedback, test scores, content adoption, and course completions. These are all leading indicators and can usually be pulled directly from your enablement platform, like Showpad.
Level 2: Behavior application metrics
Next, assess whether the training is being applied in real-world selling scenarios. Use call reviews, competency assessments, shadowing, and feedback from managers to check if the behaviors are being consistently applied — and sustained.
Level 3: Business impact metrics
Connect those early signals (from levels 1 and 2) to actual business outcomes. Look at lagging indicators such as deal size, win rate, and ramp time. These sales enablement metrics help demonstrate how your programs influence performance at scale.
Tracking sales enablement metrics and impact for a product launch
Let’s say you roll out a new product enablement initiative. Here are some examples, but there are many more potential metrics you may want to track:
- Level 1 metrics: track sales playbook engagement and completions and scores from new product learning programs. These metrics will give you the baseline to help you later answer the question: do reps who engage more with the new enablement program sell more of the new product?
- Level 2 metrics: monitor the number of meetings set about the new product, review calls where the product is mentioned, and track shares of the new product content with customers in Shared Spaces (i.e. Digital Sales Rooms).
- Level 3 metrics: measure incremental revenue from the new product. You can also use cohort testing to measure program effectiveness. This compares seller performance of those that have engaged in enablement for the product launch vs. those that haven’t.
The idea is to connect those early signals — like how often sellers are using product content — to long-term success metrics like revenue growth from the new product. If you can show that sellers who engaged with the product enablement materials are closing more deals or selling larger packages, you’ve built a narrative around enablement’s direct impact.
Measuring enablement success at the functional level
While it’s critical to measure individual initiatives, you also need to zoom out and look at sales enablement success at the functional level.
Function level measurement is when you look at how all your initiatives and efforts combined are driving long-term business goals such as:
- Improving average quota attainment
- Increasing pipeline coverage
- Reducing ramp time
- Boosting customer retention
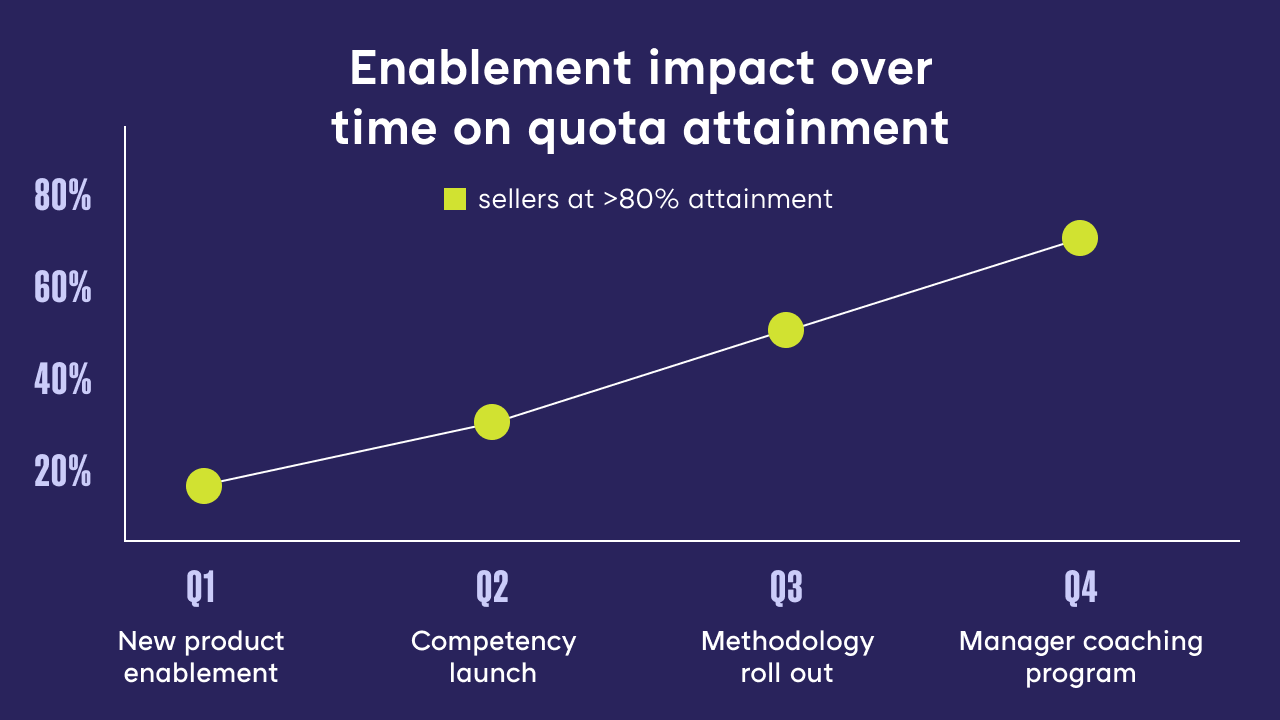
It’s important to remember that success at the initiative level feeds into success at the function level. For example, if your goal is for 80% of sellers to hit 80%+ quota attainment, you’ll want to showcase and visualize how each individual enablement program (e.g. product launch enablement, methodology roll out, competency training, and coaching for managers) over time builds into aggregate impact.
And if your enablement platform isn’t helping you measure and connect indicators to demonstrate functional impact, it may be a gap in your tech stack. Your tools should not only support your programs — they should help you tell the full story of enablement’s impact on business growth.
Celebrate your enablement wins — big and small
Not every success story needs to be long-term. A single initiative that shortens ramp or improves a key behavior can build credibility fast — so long as that behavior is maintained. These smaller wins can help unlock executive support and greater investment in enablement.
Watch “Lessons in Excellence” — a hands-on 5-step video series packed with tips and examples to help you track, connect, and communicate your enablement impact.
Sponsored by:


Sales enablement insider
Thank you for subscribing
Level up your sales enablement career & network with sales enablement experts
An email has been successfully sent to confirm your subscription.
 Follow us on LinkedIn
Sponsored by:
Sales enablement insider
Thank you for subscribing
Level up your sales enablement career & network with sales enablement experts
An email has been successfully sent to confirm your subscription.


.svg)